

Monthly Mean Reversion or Trend
Asset allocation decisions often require taking a view on whether one month's price action will reverse or continue in the subsequent month. The recent evidence is not convincing in either direction.

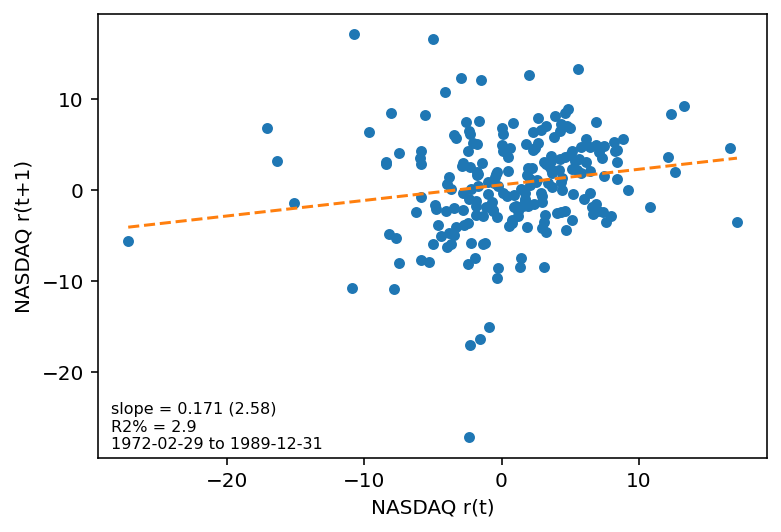
For the most part, whether an asset class does well or poorly in month t has little to say about how well it will do in month t+1. (The story may or may not be different for individual stocks, but here our focus is on asset-level returns.) But there are occasional exceptions. For example, from 1972 to 1989, positive monthly returns on the Nasdaq index tended to be associated with positive returns on Nasdaq in the subsequent month, while negative monthly returns on Nasdaq tended to be associated with negative subsequent returns. The next chart shows the collection of all month t returns (on the x-axis) and month t+1 returns (on the y-axis) for Nasdaq over this period. The dashed orange line is the best-fitting regression line to this set of points. As is clear, the line has a positive and statistically significant slope. The t-statistic, which uses robust standard errors, is shown in parentheses. The R-squared of the regression, which measures the amount of next month’s return variation that can be explained using this month’s return, is low, with a value of 2.9%. Nevertheless, there does seem to be a current-to-future month return relationship.
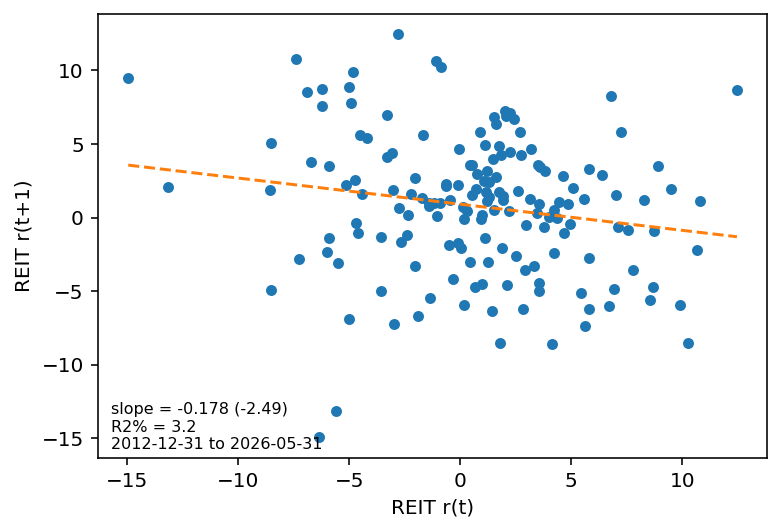
The next chart shows the same relationship for an index of real estate investment trusts (REIT) in the 2013 to 2026 time period. Here, there is a pronounced negative relationship, where one month’s returns tend to be negatively associated with the returns of the index in subsequent months, i.e., a down month tends to be associated with a subsequent up month, and vice versa. Again, the relationship is statistically significant, while the R-squared is still low, at 3.2%.
Asset allocators, especially those engaged in tactical asset allocation strategies (of the kind that we employ at QuantStreet), need to have some view on what the returns on an asset class in one month might mean for its returns in the next month. There are three options:
Month t returns have nothing to do with month t+1 returns;
Month t returns weakly, but positively, predict month t+1 returns;
Month t returns weakly, but negatively, predict month t+1 returns.
Based on our analysis below, the conclusion that month t returns strongly predict month t+1 returns can be ruled out with some confidence.
A Systematic Analysis
Using all available data in the early part of our sample, we repeat the above analysis for each of the roughly 60 asset classes that we track at QuantStreet. The next chart shows the dependence of the month t+1 return on the month t return for each asset class for which we have data in the early part of the sample. It shows something akin to the slope of the regression line from the above graphs, as well as the 95% confidence interval around that slope estimate. Specifically, it shows the coefficient on r(t) (month t return) in a regression where r(t+1) (month t+1 return) is the dependent variable and r(t) and the return of the asset class over the last year, but excluding the most recent month, are the explanatory variables. The 95% confidence interval is shown using robust standard errors.
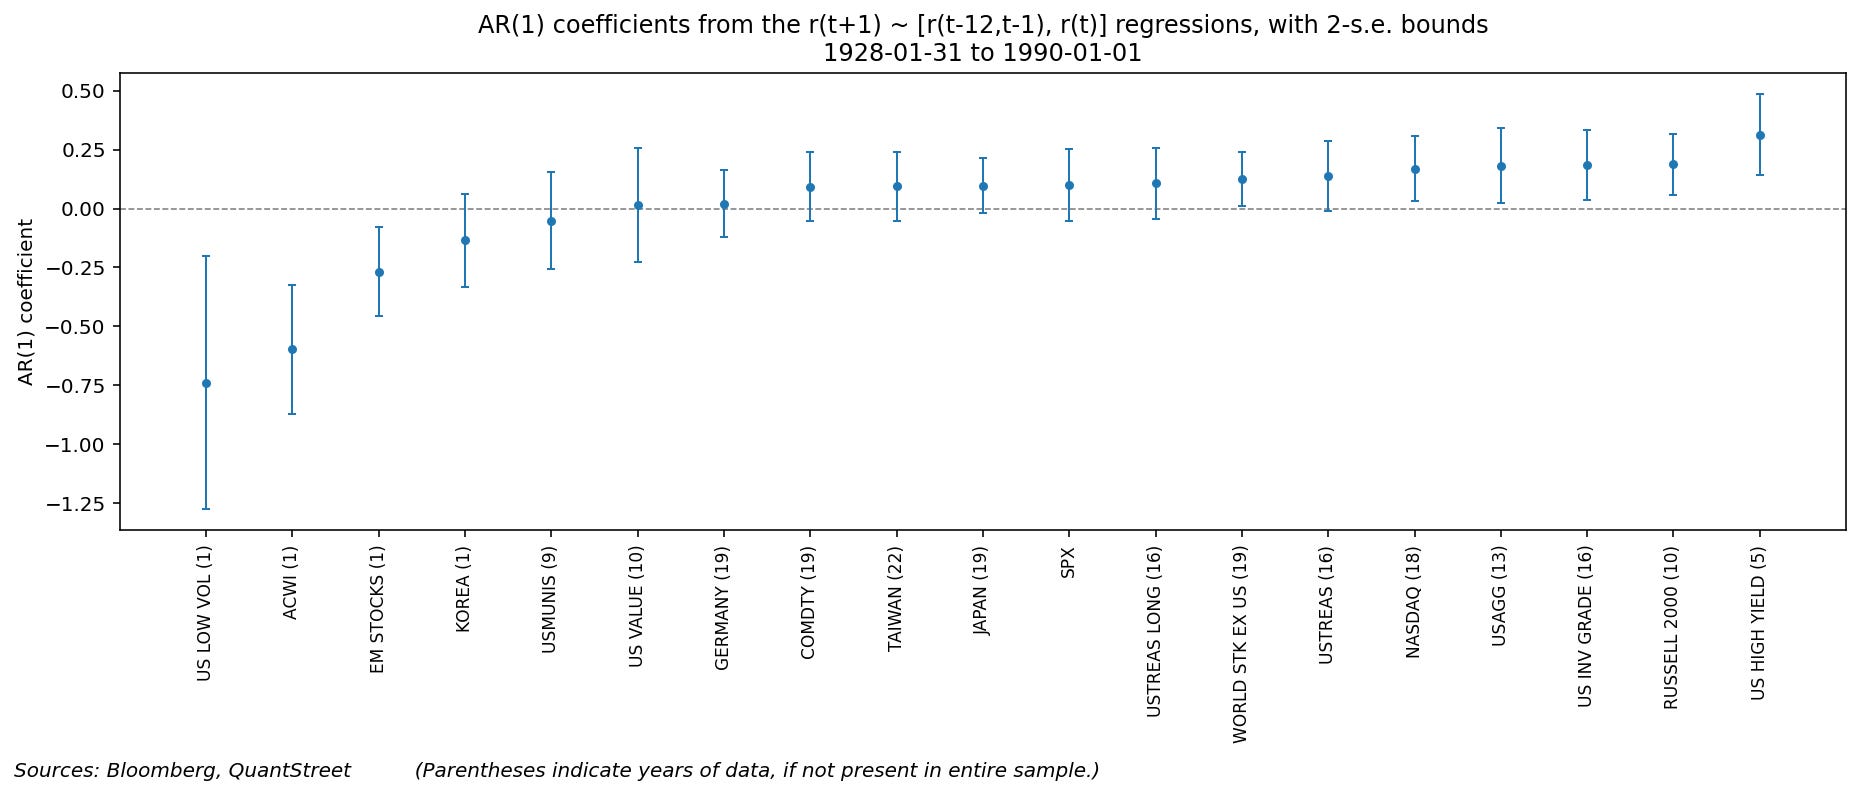
In the early part of the sample, there is some weak evidence of a negative r(t) to r(t+1) relationship for a few asset classes, like low volatility and international stocks (ACWI and EM), though there is very little data available to make this assessment (the parentheses refer to how many years of data are available for each asset class). There is more pronounced evidence of a positive relationship, with Nasdaq, US bonds (AGG), US investment grade bonds, small caps (Russell 2000), and high yield bonds all having positive and significant r(t) coefficients in the above regression.
This might be because, in the early part of the sample, stocks and high yield bonds were considerably less liquid, and the prices of the components of these indexes were not updated daily. It is well known that stale prices lead to serial correlation in returns (see for example, this paper by Mila Getmansky, Andrew W. Lo, and Igor Makarov), and if this is the underlying cause of the relationship, then this effect would not have been tradeable. Stale prices are well and good for marking indexes, but market makers would not trade at stale prices, so assuming the index itself was not tradable, the positive relationships documented above were not exploitable.
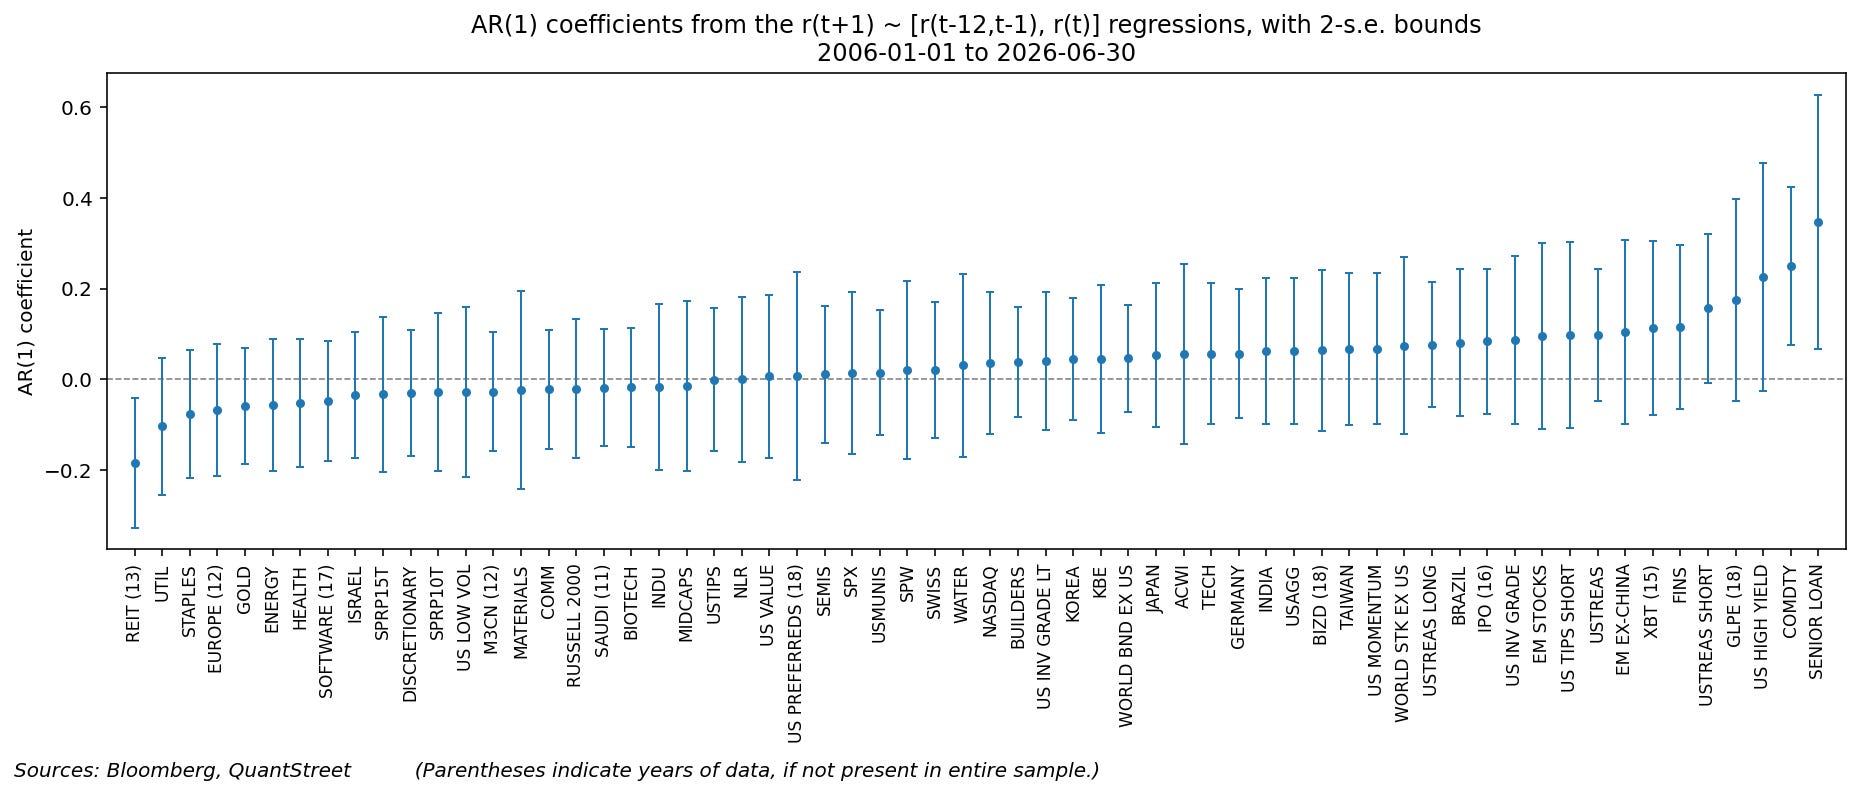
The next graph repeats the analysis over the last 20 years. Stale prices are much less of an issue in this more recent sample, especially for stocks. Indeed, all of the stock-level positive relationships documented in the earlier sample now disappear. The securities that still exhibit statistically positive time t to time t+1 return relationships are bank loans and short-term US Treasuries, as well as commodities. For short-term US Treasuries, yields are an important predictor of future returns, and last month’s returns reflect the yields of short-term Treasuries, and thus predict next month’s Treasury returns. For bank loans, one can argue that there is still a stale prices issue, but the index itself is now tradeable, so perhaps this is an exploitable observation. (High-yield bonds, which are quite similar to bank loans, also show up with a marginally significant positive relationship between time t and t+1 returns.) Finally, the positive relationship for commodities is unlikely to be caused by stale prices since commodity markets are very liquid. Perhaps lagged monthly returns reveal a positive or negative asset-class risk premium, reflected in curve backwardation or contango, respectively, which might lead to some return persistence. These risk premia may reflect persistent price effects from hedging programs.
The one significant negative relationship present in this sample is for REITs, which show a weak tendency of mean-reverting month-over-month returns. With sixty asset classes analyzed, it’s hard to make much of a single significant negative reading, which may be due simply to chance. The one thing that provides a bit of a counterweight to this argument is that several other asset classes that are somewhat similar—higher dividend yield, lower growth—show up with marginally significant negative relationships as well: utilities, staples, energy, and healthcare stocks. Perhaps there is some tendency of these more bond-like equity asset classes to overreact to news, which then leads to monthly mean reversion. The preponderance of the data, however, suggests only a weak mean-reversion tendency.
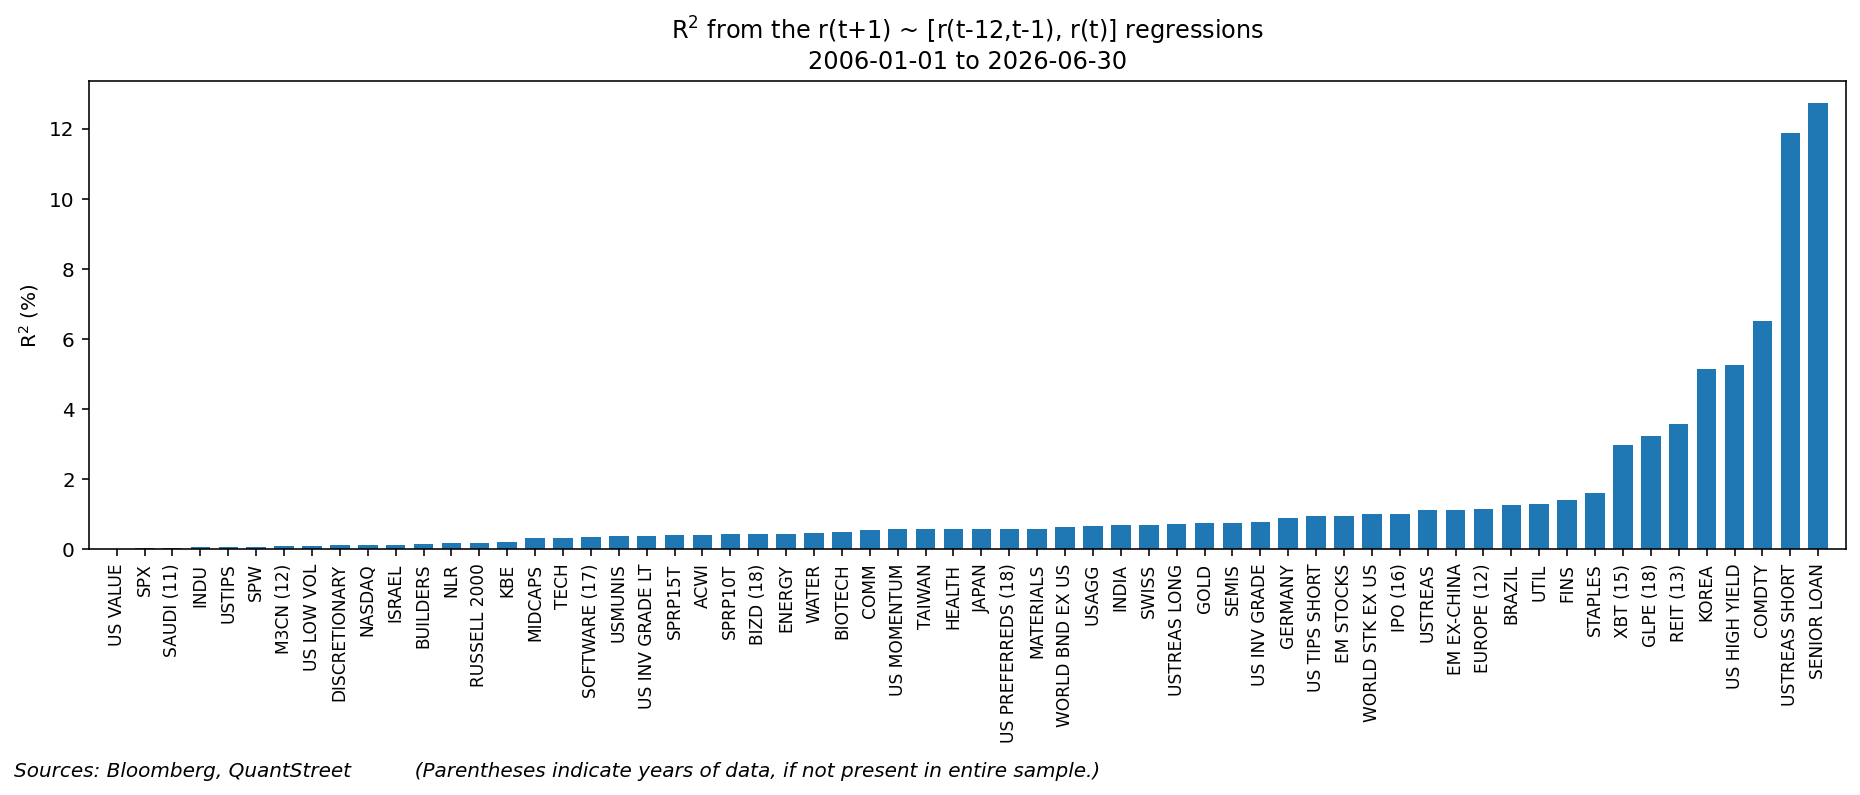
The next table shows the R-squareds of these monthly return forecasting regressions. The R-squared of a regression measures the fraction of the variation of the dependent variable, in this case month t+1 returns, that can be explained with the dependent variables, in this case the month t returns and the eleven months of returns from month t-11 to t-1. Not surprisingly, the highest R-squareds correspond to those asset classes—senior loans, short-term Treasuries, commodities—with the most evidence of predictability from month t to month t+1 returns. Nevertheless, the magnitudes of the R-squareds are generally very low. Most observations are well under 2%. The five asset classes with R-squareds in the 5% or higher range are Korean stocks, high-yield bonds, commodities, short-term Treasuries, and bank loans. (REITs, at just under 4%, are close to making the list as well.) Of these, the Korea result is likely a fluke; the others are consistent with our prior findings about month-over-month return predictability.
Caveats and Conclusion
None of the preceding is a trading strategy or investment advice. Whatever statistical tendency towards mean reversion or trend that exists (or does not exist) at the asset-class level provides zero information for the majority of market participants. Such information may only useful in a robust, systematic asset allocation strategy. Importantly, this piece is a statistical analysis of historical data. Any documented historical patterns may diminish in the future. Indeed, our own analysis suggests that monthly mean reversion and trend tendencies have significantly weakened over time.
This latter finding is not surprising. The information set of investors engaged in asset allocation is far larger than the last month’s and the last year’s asset class returns. Still, it is useful to know the extent to which there is or isn’t pure price-based return predictability at the asset class level.
Appendix
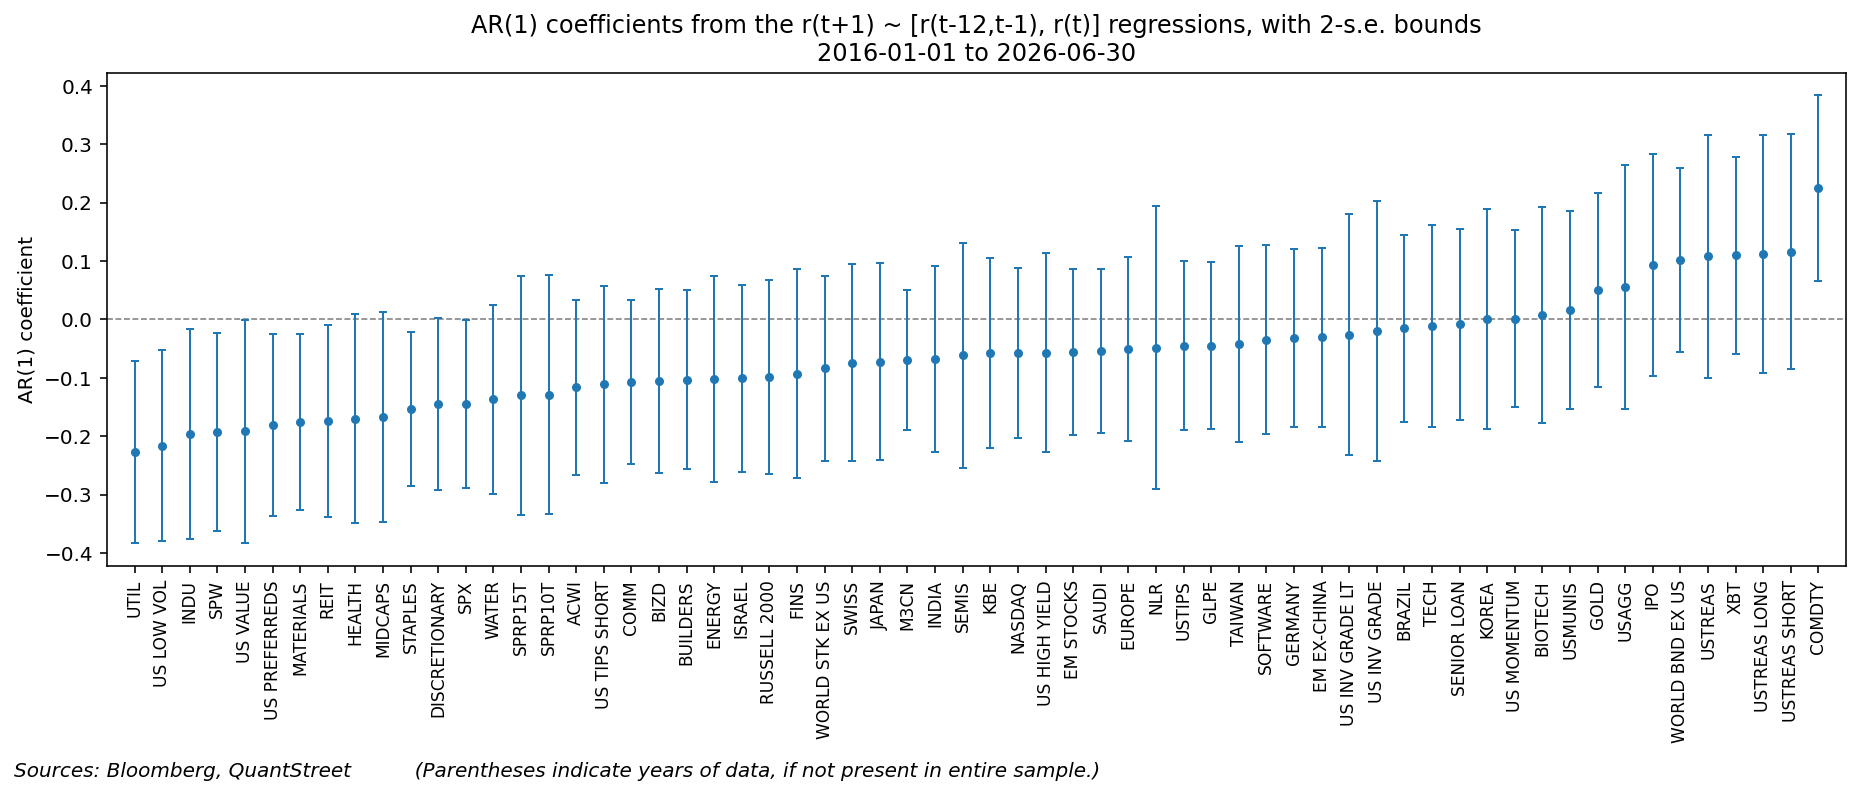
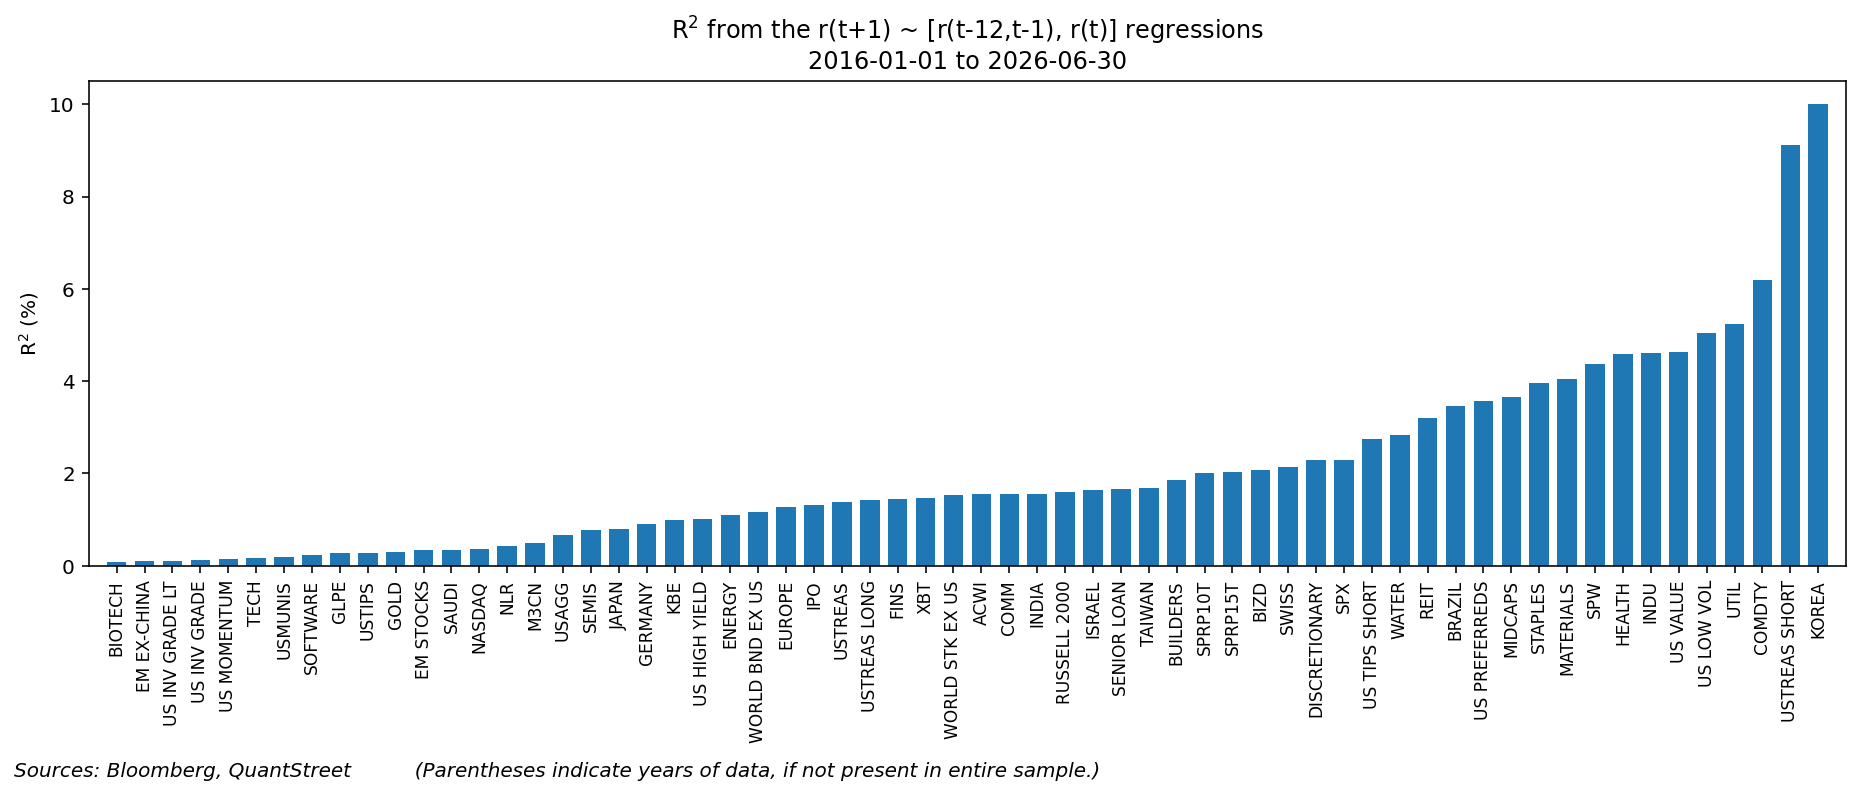
The next two figures repeat the analysis of the main part of the paper, but for the most recent ten-year period. The results are largely consistent with the 20-year sample. Commodities and Treasuries have positive relationships, and lower-growth stocks have negative ones. There are, interestingly, more asset classes with a negative forecasting relationship from month t to month t+1 returns, including value stocks, in this most recent subsample.
Working with QuantStreet
QuantStreet Capital is an SEC-registered investment advisor. It offers financial planning, wealth management, model portfolios, and portfolio analytics. The firm’s approach is systematic, data-driven, and shaped by years of investing experience. If you are an individual or family interested in portfolio management or financial planning, or an investment advisor interested in joining our platform or using our model portfolios, please reach out at hello@quantstreetcapital.com or sign up for our email list. Registration as an investment advisor does not imply a particular level of skill or training.
Sixty asset classes, one clean result: most month-to-month return relationships are noise, and the handful that aren't come from liquidity mechanics, not investor psychology. Commodities and short Treasuries persist because of curve structure, not conviction. REITs mean-revert for the same reason bond-like equities do. The data has an alibi. Trend followers still need one for their edge :)
This was pretty interesting, but leaves me with questions about how trend following can be successful. Yet the SocGen CTA index is positive and the DBMF ETF which includes equities as one of the trends they replicate has been very successful, including this year. Perhaps they use a more complex algorithm which does allow you to predict prices from trends?