Long-Dated, Low-Coupon Treasury Bonds Are Attractive
U.S. Treasury rates in the long-end of the curve appear 100 basis points too high relative to a fair-value model. The upside-downside of buying long-dated, low-coupon Treasuries is attractive.
Since their Covid lows, interest rates in the U.S. and globally have increased dramatically. The 10-year U.S. Treasury rate has gone from just over 0.50% in 2020 to close to 5% today.
I wrote a month ago about a compelling counterargument to the higher-rates narrative that has become prevalent in financial circles. While 10-year rates are up an additional 30 basis points since my article, Bill Ackman, one of the major proponents of the higher-rates narrative, has covered his (highly profitable) Treasury short position, arguing “[t]here is too much risk in the world to remain short bonds at current long-term rates.”
I am in complete agreement. In fact, I take his point one step further and argue that given everything going on in the world, going long Treasuries — and especially long-dated ones with low coupons — offers a very attractive hedge against potential bad macroeconomic and geopolitical outcomes, and one that pays you a 5% yield to boot.
There are two pillars to this argument. First, a global fair-value model for interest rates suggests that 10-year U.S. rates are currently 100 basis points above fair value. Models could be wrong, obviously, and it is possible that despite this historically high “mispricing,” interest rates could go higher still. The second part of the argument is that, if rates do go higher, they are unlikely to go much higher from current levels, which makes the upside-downside of going long Treasuries attractive, especially so for long-dated, low-coupon ones, for reasons I discuss below.
Fair value for 10-year rates
The QuantStreet fair-value rates model is estimated using the last several decades of data from eight major economies: Australia, Canada, Germany, Japan, Norway, Switzerland, the U.K., and the U.S. The model relates the current level of nominal 10-year rates in each country to their last-12-month (LTM) GDP growth, LTM inflation, the LTM inflation from 12 months ago, the most recent unemployment rate, the most recent current account level as percent of GDP, and the most recent government debt-to-GDP ratio. Based on the historical relationship between these variables and 10-year nominal interest rates in these countries, the model determines a fair value for the 10-year rate. Comparing the prevailing 10-year rate against this fair value estimate gives a sense of market mispricing.
An important relationship identified by the model is between the most recent and 12-month back LTM inflation and the current level of interest rates. Both are positively related to the current level of nominal 10-year yields. A plot of the last-12-month inflation rate versus 10-year rates in the U.S. suggests that the recent drop in inflation from its post-Covid highs is likely to be associated with falling rates, eventually.
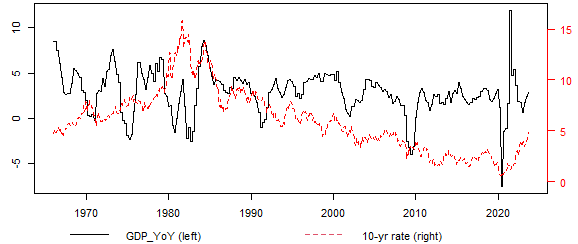
There is also a historical association between high year-over-year GDP growth and the level of nominal 10-year rates. In fact, one of the reasons for the recent run-up in rates is that investors are anticipating a continuation of faster growth. On the other hand, credit conditions are tightening (e.g., 30-year mortgage rates are above 8%), with the recent increase in interest rates in the long-end of the curve providing a further dampening effect on growth. Furthermore, the Fed is very focused on slowing economic growth in its fight to contain inflation. As growth slows, a major driver of the higher-rates narrative will go quiet.
Finally, much attention has been focused on the large supply of Treasury bonds on offer in the U.S. to fund currently high budget deficits. However, the historical relationship between government debt and nominal rates has been strongly negative in the eight developed market economies I analyze.
Since rates are a primary tool of central bank monetary policy, with higher debt in the economy, it takes a smaller increase in interest rates to slow growth. Given the historically high government debt-to-GDP level in the U.S., Treasury rates don’t have to rise all that much to achieve the Fed’s goal of slower growth and lower inflation. The increased economic sensitivity to rate levels that comes with a higher debt load is an offsetting effect to the short-term impact of higher supply.
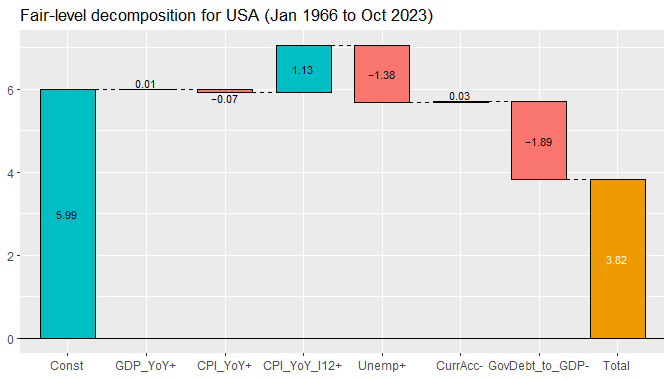
Combining all the influences captured by the model yields a fair-value for the 10-year nominal rate of 3.82%. The model starts with the average level of U.S. 10-year rates in the sample, 5.99%, and then adjusts this level based on deviations of the current values of the forecasting variables from their long-run means. The very elevated LTM inflation from 12 months ago contributes positively to the fair-value interest rate. The currently low level of unemployment, and the positive relationship between unemployment and the level of rates, decreases the fair value. Finally, the currently high U.S. government debt-to-GDP ratio decreases the fair value rate further to 3.82%.
Comparing the actual 10-year interest rate to the model fair value shows that the two series have tracked each other well historically, though part of this relationship is mechanical in nature, having to do with how the model parameters are estimated.
Looking at the difference between the 10-year Treasury market rate and the model-implied fair value shows that the market rate is now 1.02% higher than the model’s fair value. The last time the deviation was this large was over 20 years ago, suggesting that the current gap between market and model rates may be due for a correction. (This is related to recent work which shows that the interest rate risk premium in the long-end of the Treasury curve has risen recently.)

The model conclusion mirrors Ackman logic in exiting his Treasury short position: Current rate levels seem quite high relative to fundamentals and potential macroeconomic and geopolitical risks.
Long-dated, low-coupon bonds
Long-dated Treasury bonds provide an attractive vehicle to express the view that interest rates are high relative to their macro-based fair value. While the fair-value model is calibrated using 10-year interest rates (due to better data availability), 10- and 30-year rates typically move in tandem, so 30-year rates can be expected to largely mirror the behavior of 10-year rates.
Consider what’s happened to the 1.25% coupon 30-year Treasury bond issued in May of 2020. Its price has fallen from close to par ($100) to under $45 today.
Buying this bond now will result in a net-off carry return of +35.4% if rates fall by 150 basis points and a loss of -24.7% if rates increase by 150 basis points (shown via the blue curve in the figure below). Add to this the 5% annual carry from owning this bond and the possibility that the next rate move will be lower rather than higher, and the economics of the trade begin to look quite attractive.

Compare this to the return scenarios from buying a higher dollar price 30-year Treasury, the 4.125% coupon bond issued in August of this year. In this case, if rates fall 150 basis points the ex-carry gain would be +28.9% and if rates increase by 150 basis points the ex-carry loss would be -20.4%. While the downside loss is smaller than in the case of the 1.25% coupon Treasury, the upside is smaller still, which favors the lower-coupon 30-year Treasury’s risk-reward characteristics.
Comparing both of these bonds to the economics of buying a high-coupon 10-year Treasury bond — upside of 12.9% for a 150 basis point rate drop and downside of -11.2% for a 150 basis point rate increase — suggests the reward-risk ratio is more attractive for 30-year bonds and especially so for low-coupon 30-year bonds.
Finally — taking this logic to the extreme — consider that in June of 2020 the government of Austria issued a zero-coupon 100-year bond at a price of roughly €65. This bond is now trading below €3.
A similar analysis to the above shows that if Austria government rates fall by 150 basis points the return on this bond will be +317% and if rates increase by 150 basis points the loss will be -76%. Clearly this is not for the faint-of-heart, but the upside-downside ratio on this highly volatile investment is very large. Keep in mind, though, that this bond entails taking on Austria government credit risk (the bond is Aa1-rated by Moody’s and AA+ by S&P) as well as dollar-euro exchange rate risk for U.S.-based investors.

Conclusion
The recent increase in interest rates, coupled with the existence of long-dated low-coupon government bonds, has created attractive risk-reward opportunities in case macroeconomic and geopolitical conditions lead to lower rates. QuantStreet’s fair-value model suggests that U.S. 10-year interest rates are approximately 100 basis too high relative to fundamental drivers, a finding which is consistent with recent work showing an increase in the term-premium for long-dated bonds.
Investors should keep in mind that 30-year (and especially 100-year) bonds are very volatile and can lose a lot of money if interest rates increase. The sizing of Treasury bonds in investor portfolios should reflect this risk, as well as other existing positions and investor risk preferences and liquidity needs. Those unsure how to proceed should consult with an investment advisor.


